Leveraging KPIs to Deliver Actionable UX Research Insights

For one of the company's largest sites, the project lead tasked me with analyzing the helpdesk to uncover patterns in user issues and support efficiency.
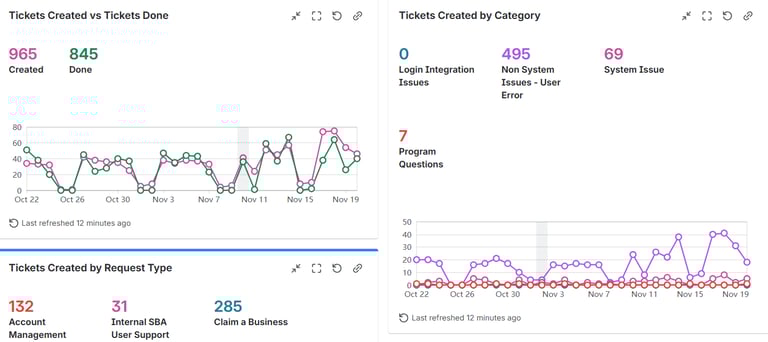
I collaborated with the project manager to identify available data, including ticket labeling in JIRA. She configured a custom dashboard layout, which I then populated with targeted reports covering:
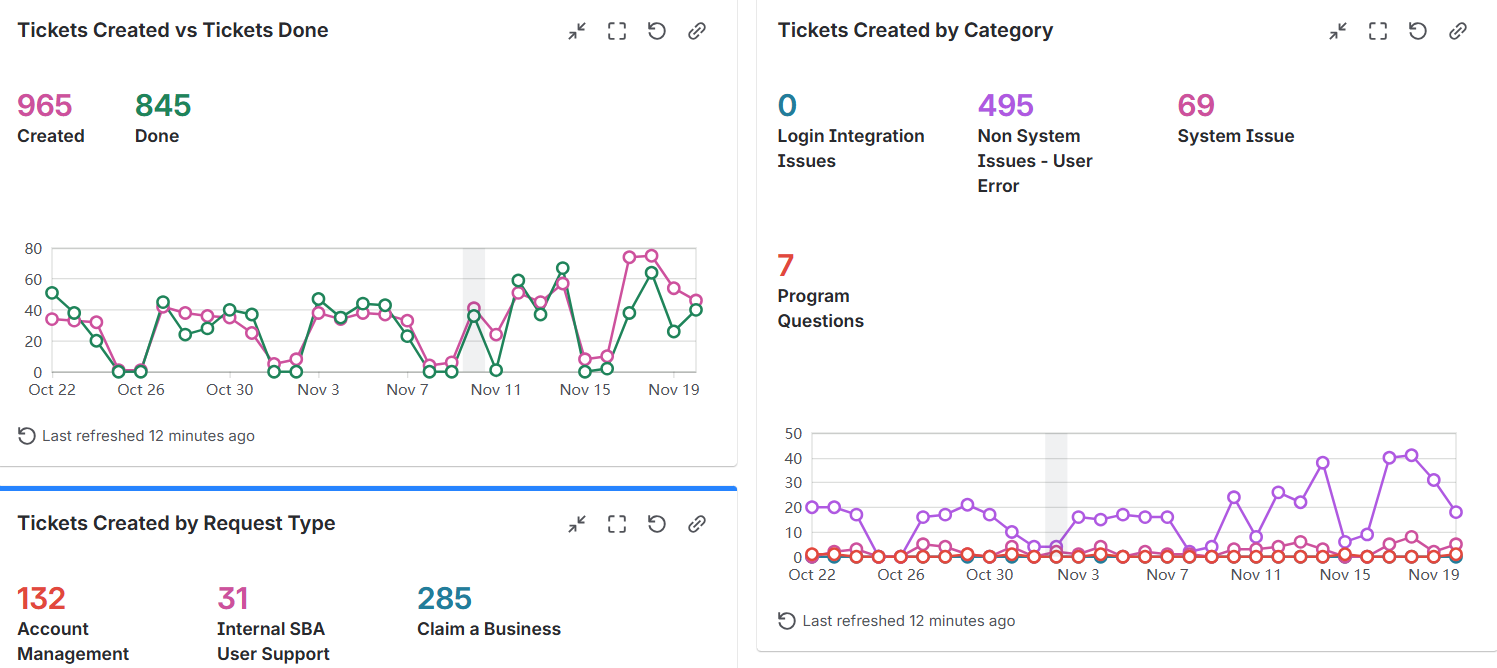
Daily ticket submission and resolution volumes
Issue resolution rates (solved vs. unresolved)
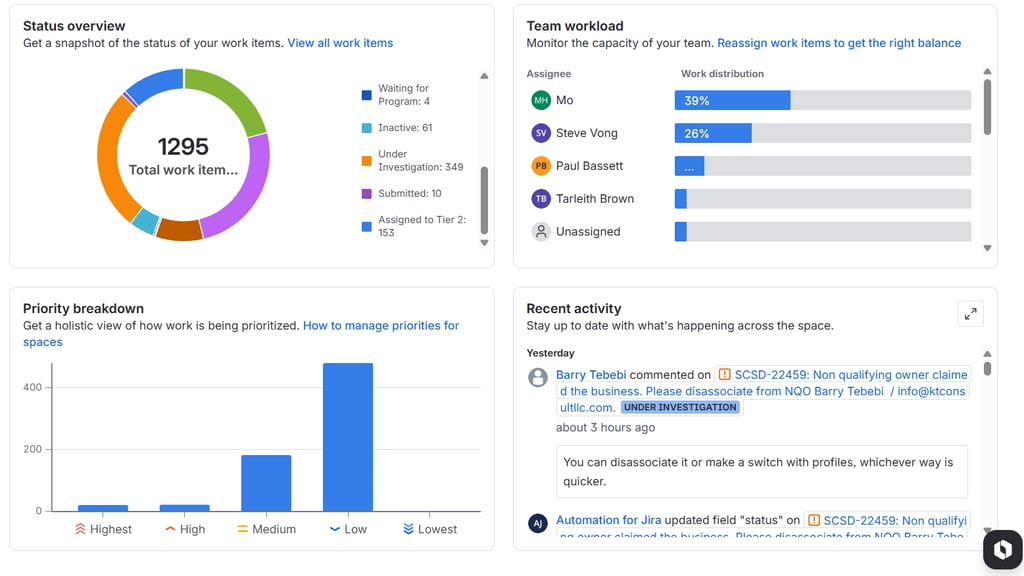
Internal vs. external ticket distribution
Overall ticket volume trends
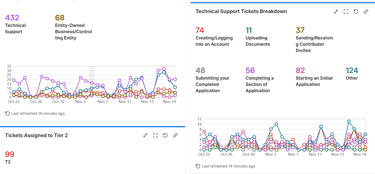
Tier 2 escalation frequency
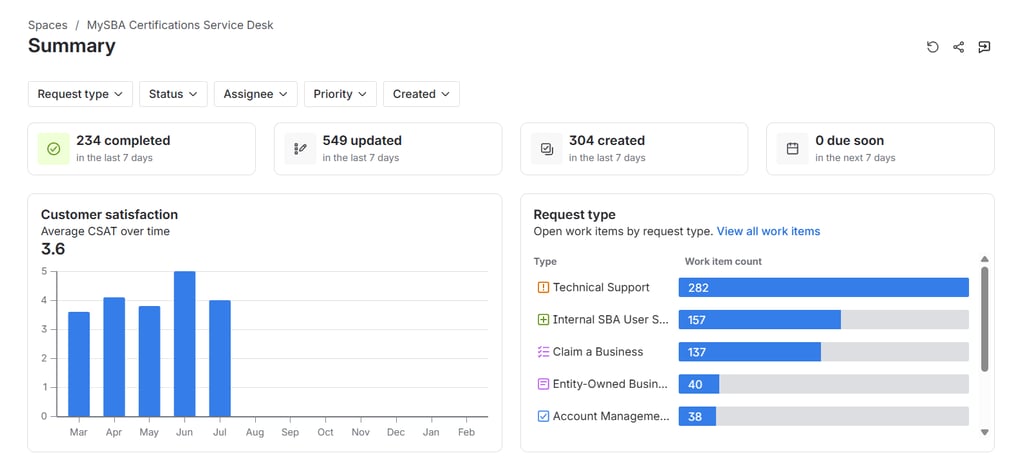
To enhance clarity and visual impact, I created a summarized JIRA Space overview that presented key statistics in a more accessible, visually compelling format.
The resulting dashboard and summary provided the team with clear, data-driven insights into user pain points, informing prioritized UX improvements and reducing support friction.